How SCADA Improves Downtime Visibility in Factory Automation Systems




Start with the downtime blind spots, not the SCADA features
When technical teams evaluate factory automation systems SCADA capabilities, the first mistake is looking at screen design, dashboard count, or alarm volume before asking a simpler question: what downtime is currently invisible? In most plants, the painful losses are not the dramatic line stops everyone remembers. They are the short interruptions, repeated micro-stoppages, unlogged operator waits, slow recoveries after faults, and machines running in a degraded state while production quietly slips.
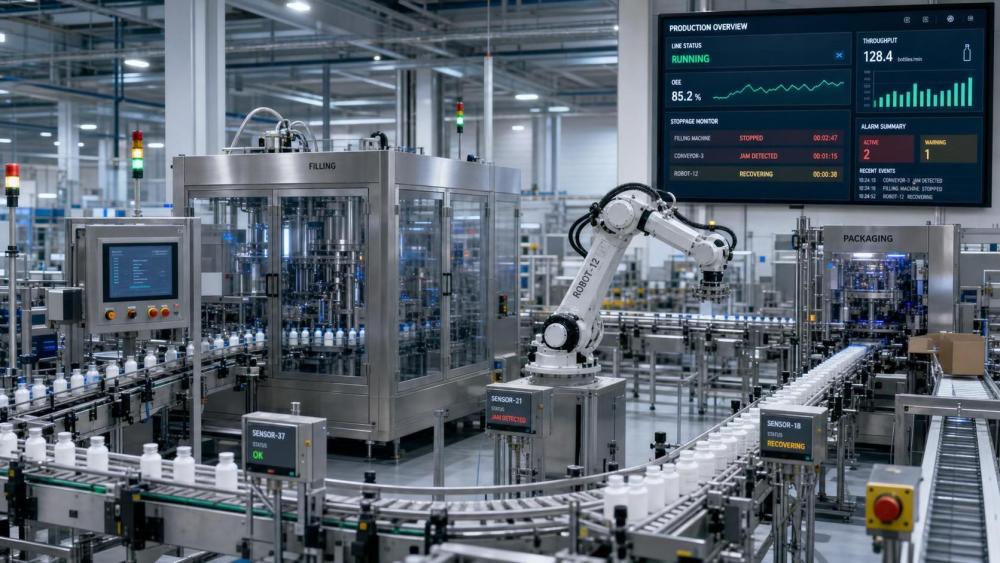
A useful SCADA layer does not just tell you that a machine stopped. It shows when the event started, what condition led to it, how long the process stayed down, what happened before restart, and whether the same pattern is repeating across shifts or assets. If that chain is missing, downtime visibility is still weak even if the plant has plenty of screens.
So before comparing platforms, walk through the loss points your site actually struggles with: packaging jams, conveyor accumulation, robot cell interlocks, utility interruptions, sensor failures, changeover delays, waiting for operator acknowledgment, or maintenance response lag. That gives you a practical checklist instead of a software brochure review.
Check whether SCADA can separate a stop, a slowdown, and a blocked condition
This sounds obvious, but it is often where downtime reporting gets distorted. In real production, not every loss looks like a clean machine-off state. A filler may keep cycling below target speed. A downstream palletizer may force upstream equipment into hold. A robot may be available but waiting on material. If the system records all of these as the same generic stop, your root-cause analysis will be weak from day one.
What to check:
- Does the SCADA logic distinguish faulted, starved, blocked, manual mode, changeover, and reduced-speed operation?
- Are these states derived from actual control signals and process conditions, or entered manually after the fact?
- Can the state model be aligned with how production and maintenance teams already talk about the line?
If the answer is no, the reports may look tidy but they will not explain where time was really lost. In technical evaluations, this matters more than the number of charts on the interface.
Verify event timestamps at the source
Downtime visibility depends on timing accuracy. A delay of a few seconds may not matter for long outages, but it matters a lot for short stops and sequence troubleshooting. If a jam happens, a drive trips, the operator acknowledges, and the line restarts within a minute, poor timestamp discipline turns the event history into guesswork.
The right check here is not “does the SCADA system log time?” Every system does. The real check is where the timestamp comes from and whether clocks are synchronized across PLCs, HMIs, edge devices, historians, and SCADA servers. If different devices stamp the same event differently, fault sequences become unreliable. That causes bad maintenance calls, bad line-balance conclusions, and a lot of wasted argument between controls, operations, and maintenance.
In practice, ask for a sample event chain from one known machine fault and inspect the order of events, not just the event list itself.
Look at alarm quality before you trust downtime reports
Plants with poor alarm discipline usually have poor downtime visibility too. Alarm floods hide the initiating fault. Nuisance alarms train operators to ignore screens. Repeating alarms may create the appearance of many failures when there was really one unresolved condition upstream.
A clean SCADA implementation for factory automation systems should help you answer three things quickly:
- Which alarm first caused the loss of production?
- Which alarms were consequences of that first event?
- What operator or maintenance action cleared the condition?
If all alarms are treated equally, operators spend time hunting symptoms while the downtime clock keeps running. During evaluation, ask to see alarm shelving, prioritization, acknowledgment handling, and state-based suppression. Those are not side features. They directly affect how clearly you can see downtime.
Make sure SCADA captures context, not just fault codes
Fault codes alone rarely explain why production stopped. They tell you what the controller recognized, not what the process was doing. For technical evaluators, the stronger question is whether SCADA logs the process context around the event: machine mode, recipe, active product, line speed, upstream and downstream status, operator command, and critical analog values such as temperature, pressure, torque, or current where relevant.
Without that context, the maintenance team may know a motor overload occurred but still not know whether it happened during startup, product transition, accumulation, or abnormal load. That is the difference between repairing the symptom and preventing the repeat.
A practical review method is to pick one common failure mode and ask: if this happens at 2:10 a.m. on third shift, can the next engineer understand it from the SCADA record alone, or will they need to phone the operator?
Test whether the system exposes recovery time, not only stop time
Many sites measure when equipment stops and when it starts again, then call the gap “downtime.” That is useful, but incomplete. In automated production, a large share of lost capacity sits in recovery: clearing material, homing axes, reestablishing communication, warming up process conditions, or waiting for downstream release.
A better SCADA setup lets you separate:
- time to detect the event,
- time to acknowledge and respond,
- time to repair or clear the fault,
- time to return to stable production rate.
That breakdown matters when you are comparing automation investments. One system may not reduce the number of stops dramatically, but it may shorten diagnosis and restart time enough to justify the architecture.
Check line-level visibility, not just machine-level status
Individual machine data can still leave you blind at line level. A machine may report “ready,” but production is down because material handling is congested, a buffer is full, or an upstream station is underperforming. This is common in conveyors, packaging cells, robotic transfer systems, and mixed manual-automatic lines.
During evaluation, verify whether the SCADA design can show dependency chains across assets. You want to see which equipment was the true production constraint, not just which machine displayed the loudest alarm. Good line visibility often requires equipment state aggregation, line-state logic, and views built around process flow rather than isolated asset pages.
If the platform stops at machine monitoring, it will miss a lot of system-level downtime causes.
Use a simple review table during technical evaluation
Check how manual input is used
Manual reason codes are still common, and sometimes necessary, especially where process interruptions involve operator actions or production scheduling. But they should support automated event capture, not replace it. If the downtime record depends too heavily on operators entering reasons after the line is back up, accuracy drops fast. Shift pressure, inconsistent terminology, and delayed entries will distort the picture.
A more reliable approach is to auto-detect the event and then ask for limited operator classification only where the control system cannot infer business context, such as planned cleaning, material shortage, or waiting on quality release. That keeps the core timeline objective while preserving the operational detail evaluators still need.
Don’t ignore historian depth and retrieval speed
Downtime visibility is not only a real-time problem. Technical evaluation also needs to ask whether the plant can retrieve enough historical detail to analyze repeat losses over weeks, campaigns, product families, or maintenance intervals. Some SCADA projects look fine during demos but become frustrating when engineers try to compare repeated faults across long periods.
Review how event history, trend data, and asset states are stored and searched. If extracting a month of meaningful downtime information requires manual report cleanup every time, the system will be used less than expected. In the field, that usually means the plant falls back to spreadsheet approximations, which defeats the value of structured automation data.
Evaluate the handoff between operations and maintenance
One of the most practical ways SCADA improves downtime visibility is by reducing the gap between who sees the problem and who fixes it. But that only happens when event information is understandable across functions. Operators need clear fault identification and response prompts. Maintenance needs enough detail to isolate the probable source. Supervisors need line impact and duration. Engineers need repeatability and sequence history.
If each group gets a different, disconnected view, the plant will still waste time in handoffs. During assessment, ask whether the same event can be traced from operator screen to alarm log to maintenance analysis without reinterpreting labels or losing context.
Prioritize these checks in order
If you are short on time, do not start with cosmetic comparisons. Review the state model first. Then validate timestamps, alarm quality, context capture, and recovery tracking. After that, check historian usefulness and cross-functional usability. That sequence usually tells you whether the SCADA layer will genuinely improve downtime visibility in factory automation systems or simply produce more screens around the same old uncertainty.
The core decision is straightforward: choose the setup that makes lost time explainable, repeatable, and actionable at line level. When SCADA does that well, downtime stops being an argument about what happened and becomes a workflow for fixing what keeps happening.
Related News
 What is driving consolidation in the global equipment supplier market?IEG Heavy Machinery & Automation AnalystGlobal equipment supplier market consolidation is accelerating through technology, service, and supply-chain demands. Discover how buyers can capture value while managing risk.
 When does capital equipment investment pay back in manufacturing?IEG Heavy Machinery & Automation AnalystCapital equipment investment manufacturing: learn when equipment truly pays back by evaluating full costs, cash flow, ramp-up, operational risks, and lifecycle value.
 When does a distribution center need an automated pallet handling system?Heavy Lifting Systems AnalystPallet handling systems help distribution centers overcome labor shortages, bottlenecks, safety risks, and storage constraints. Discover the key signs it’s time to automate.
 How to build a machinery investment plan around payback periodIEG Heavy Machinery & Automation AnalystMachinery investment planning manufacturing guide: build a credible payback plan with full costs, ramp-up assumptions, lifecycle risks, and scenario-based cash benefits.
 How to Specify a Modular Packaging Line for Fast Changeovers and Scalable OutputRobotics EngineerModular packaging line specification guide: achieve faster changeovers, scalable output, reliable controls, and lower lifecycle costs with practical planning.
 How industrial IoT devices reduce unplanned downtime in factoriesRobotics EngineerIndustrial IoT devices help factories detect early equipment issues, plan maintenance, and reduce costly unplanned downtime before production is disrupted.
 What is driving industrial machinery market demand in manufacturing?IEG Heavy Machinery & Automation AnalystIndustrial machinery market manufacturing demand is rising as factories pursue automation, energy efficiency, resilient supply chains, and lifecycle productivity gains.
 316L Stainless Steel Pipe Tube Technical Factors That Shape Buyer DecisionsCNC Machining AnalystA technical analysis for 316L stainless steel pipe tube buyers, covering corrosion expectations, pipe route choice, tolerance, surface, and inspection.
 How ground conditions determine crawler piling equipment selectionConstruction Equipment SpecialistCrawler piling equipment selection starts with ground conditions. Learn how soil, rock, groundwater and site constraints shape safer, more productive piling solutions.
 3300mm CNC Beam Saw Sheet Capacity: Layout Checks Before PurchaseCNC Machining AnalystZhongding ZD330 beam saw specifications: assess 3300mm sheet capacity, layout clearances, handling flow, and acceptance checks before buying.
 How Bucket Chain Diamond Dredgers Meet ISO 12100 Safety Requirements in Alluvial Mining ProjectsMining Infrastructure ExpertBucket chain diamond dredger safety made real: how ISO 12100 compliance ensures operator protection, reliability & zero lost-time injuries in alluvial mining.
 Modular Packaging for High-Mix Automotive Assembly Lines: How Standardized Load Units Reduce Line Changeover Time by 37% — Case Study from Tier-1 Supplier in GuangdongHeavy Lifting Systems AnalystModular packaging slashes automotive line changeover time by 37%—discover how standardized load units boost OEE, cut labor costs, and enable seamless high-mix assembly.