Mining Equipment Reliability: Metrics That Predict Downtime in Harsh Operations




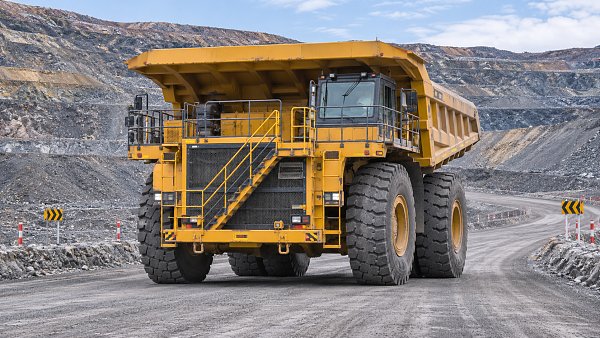
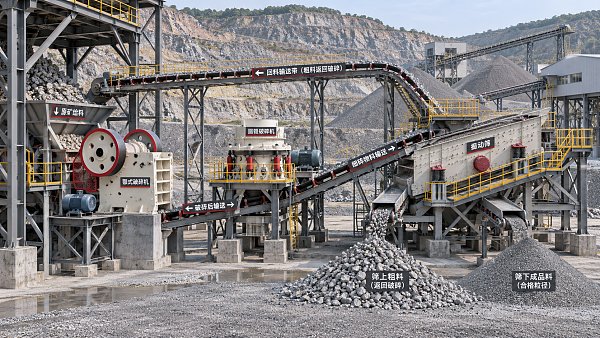
In harsh mining operations, downtime is rarely predicted by a single alarm, a missed service interval, or a fleet-wide availability figure. The most useful warning signs appear when operating exposure, component condition, repair execution, and parts readiness are read together. A haul truck may retain acceptable monthly availability while repeatedly losing time to overheating, brake wear, or electrical faults. A crusher can meet its planned maintenance schedule while vibration and oil debris indicate a developing bearing failure.
Mining equipment reliability is therefore not simply a record of whether machines ran yesterday. It is the ability to identify whether a failure mechanism is accelerating, whether the maintenance response is removing its cause, and whether the site can recover before a localized defect becomes a production interruption or safety event.
Availability is an outcome, not an early-warning metric
Physical availability is widely used because it is easy to communicate:
Physical Availability (%) = Scheduled Time − Downtime / Scheduled Time × 100
It remains important for fleet reporting, but it is a lagging result. It does not distinguish a machine with one major engine failure from one suffering repeated short hydraulic, electrical, or sensor-related stoppages. Both may show the same monthly availability, while their maintenance implications are entirely different.
Availability also becomes misleading when definitions vary. Planned maintenance, standby time, waiting for an operator, weather delays, and lack of parts may be coded differently across shifts or sites. Before using availability to judge reliability, the maintenance system needs a controlled downtime taxonomy. At minimum, records should separate:
- corrective repair after functional failure;
- planned preventive work;
- condition-based intervention;
- delay awaiting labour, tools, access, or parts;
- external or operational delays that do not reflect equipment condition.
Without that separation, a rising downtime number cannot tell whether the issue is asset health, planning discipline, supply-chain delay, or operating practice. The predictive value lies in the trend and composition of downtime, not in the headline percentage alone.
MTBF must be tied to a defined failure mode
Mean time between failures (MTBF) is often treated as the central mining equipment reliability metric. In its basic form:
MTBF = Total Operating Time / Number of Failures
For mobile equipment, operating time should normally be engine hours, machine hours, or productive operating hours rather than calendar time. For fixed plant, running hours, tonnes processed, starts, cycles, or equivalent operating exposure may better reflect wear. The denominator must be equally clear: only failures that cause loss of required function should be counted, and the functional threshold must be consistently defined.
A fleet-level MTBF can conceal the mechanism that matters. Consider a loader with frequent low-voltage shutdowns, a second loader with one major transmission event, and several healthy machines. The combined MTBF may not look unusual. Yet the repeated electrical interruptions may be the more urgent reliability problem because their interval is shortening and because they can cause unsafe machine behaviour or escalating harness and connector damage.
A stronger approach is to calculate MTBF by asset class, subsystem, and failure mode. Examples include:
- engine cooling-system failure interval;
- hydraulic hose or fitting failure interval;
- traction motor or final-drive failure interval;
- crusher lubrication fault interval;
- conveyor belt-tracking or idler-related stoppage interval.
The useful question is not whether the fleet MTBF improved. It is whether the interval for a known failure mechanism is stable, extending, or compressing after exposure is considered. A declining MTBF for a particular subsystem is a direct prompt to inspect installation quality, contamination control, operating load, calibration, maintenance history, and design suitability.
MTBF also has limits. It assumes that failures are comparable and that the selected population is meaningful. A mixed fleet with different ages, duty cycles, payloads, and rebuild histories should not be pooled casually. The result can look statistically tidy while offering little maintenance guidance.

Failure frequency should be read beside severity
Repeated short-duration faults are often dismissed because each event consumes little time. This is a costly mistake. A fault that stops a machine for 10 minutes but occurs repeatedly can create lost production, operator disruption, nuisance alarms, rushed troubleshooting, and an elevated risk that the underlying defect remains unresolved.
Track both failure count per operating hour and downtime hours per failure. Their combination separates distinct patterns:
This distinction matters especially in remote operations, where recovery time is affected by travel distance, isolation requirements, lifting access, weather, shift change, and specialist availability. A major failure may be technically repairable in a few hours but remain unavailable much longer because the repair chain was not prepared.
MTTR reveals whether the maintenance system can recover
Mean time to repair (MTTR) is commonly calculated as:
MTTR = Total Corrective Maintenance Time / Number of Corrective Repair Events
MTTR should not be interpreted as technician wrench time alone. For downtime analysis, it is more useful to distinguish the stages that consume elapsed time:
- fault detection and notification;
- diagnosis and confirmation;
- machine isolation, cooling, cleaning, or safe access;
- waiting for people, tools, lifting equipment, or parts;
- repair and replacement work;
- testing, commissioning, and return to service.
A high MTTR can reflect poor component accessibility, but it can also expose weak diagnostic information or incomplete job preparation. On large excavators, drills, shovels, and crushers, safe access and isolation are necessary constraints rather than inefficiencies. The target is not to minimize repair time at any cost. It is to remove avoidable delay while preserving work quality and safety controls.
For recurring work, compare planned labour hours, actual hands-on hours, and total elapsed downtime. If hands-on time is stable but total downtime rises, the bottleneck may be logistics. If actual hands-on time regularly exceeds the job plan, the repair method, access arrangement, tooling, component interchangeability, or scope definition may need revision. If the machine returns repeatedly for the same repair, a lower MTTR may merely indicate fast rework rather than effective maintenance.
Condition indicators predict failures before functional loss
Condition monitoring produces useful reliability intelligence only when measurement quality, trend history, and failure mode are linked. A single high temperature or vibration value is not enough to condemn a component without understanding load, ambient conditions, sensor placement, baseline behaviour, and measurement repeatability.
For rotating and lubricated systems, the most informative indicators commonly include:
- vibration trend and spectral changes in bearings, gearboxes, motors, pumps, fans, and crusher drives;
- oil cleanliness, water contamination, viscosity change, oxidation, and wear-metal trends;
- bearing, winding, coolant, exhaust, hydraulic oil, and gearbox temperature trends;
- filter restriction, pressure differential, and suction conditions;
- hydraulic pressure stability, pump case-drain flow, actuator drift, and cycle-time deviation;
- brake wear, brake temperature, retarder performance, and pressure response on mobile equipment.
Trend direction matters more than an isolated reading. A stable temperature that is above a generic reference may be normal for a particular machine in a particular duty cycle. A gradual change from that machine’s own baseline, especially when accompanied by abnormal oil debris, vibration, pressure fluctuation, or rising power demand, is more actionable.
Condition data should be connected to a defined decision: inspect, resample, reduce exposure, schedule intervention, or continue monitoring. If no action threshold or review responsibility exists, data collection becomes administrative rather than predictive.
Contamination control is a leading reliability measure, not a housekeeping detail
Dust, moisture, poor filtration, and uncontrolled lubricant handling can shorten the life of hydraulic and powertrain components long before operators notice a performance problem. Harsh mining environments make contamination control a reliability discipline rather than a support activity.
Useful leading indicators include repeat filter restriction alarms, recurring water ingress in samples, particle-count movement after maintenance, breather condition, seal damage, and the proportion of lubricant samples taken correctly and on schedule. A sudden change after a hose replacement, cylinder repair, or oil top-up may point to maintenance-induced contamination. That is different from contamination caused by normal environmental exposure and requires a different corrective action.
Oil analysis is most valuable when sampling intervals reflect risk. Sampling a lightly loaded gearbox at the same frequency as a high-load crusher gearbox may produce data but not necessarily control risk. Criticality, lubricant volume, consequence of failure, duty severity, and known failure modes should determine the monitoring plan.
Backlog age shows whether known defects are being allowed to mature
Maintenance backlog is often measured in labour hours, but its age and risk profile are more predictive of downtime than its total size. A manageable backlog can contain planned improvements, deferred non-critical tasks, and work awaiting a suitable shutdown window. A dangerous backlog contains condition findings and repeat defects that remain open while the machine continues to operate.
Track the age of corrective work orders by priority, subsystem, and known failure mode. A rising count of overdue high-consequence defects indicates that the operation is consuming reliability margin. Repeatedly deferring a leak, loose mounting, abnormal temperature, or intermittent control fault may turn a planned repair into an unplanned outage because the deterioration rate was not reassessed.
Work-order quality is essential here. “Repair hydraulic leak” provides little predictive value. A useful record identifies the location, failed item, symptom, suspected mechanism, contamination condition, repair performed, parts fitted, verification result, and whether the defect had occurred before. Failure coding does not need to be excessively detailed, but it must be specific enough to separate a hose abrasion issue from a fitting torque issue, a seal compatibility issue, or damage caused by hose routing.
Parts availability must be measured against failure criticality
Parts availability is often discussed only after a machine has stopped. For reliability management, it should be measured before the failure occurs. The critical question is not whether a storeroom carries a high volume of inventory; it is whether the parts needed to recover high-consequence assets are available in usable condition within the required response time.
A critical-spares review should account for component lead time, repairable exchange options, shelf life, preservation requirements, commonality across the fleet, supplier repair capability, and the time needed to transport the item to the point of work. Electronic modules, sensors, hoses, bearings, seal kits, filters, and wear components may each require different stocking logic.
Track downtime caused by waiting for parts separately from mechanical repair time. Then review which stock-outs recur, whether demand was predictable from condition data or maintenance plans, and whether the item was genuinely unavailable or simply not locatable, not preserved, or not released through the materials process. These are different control failures.
Reliability metrics fail when operating context is ignored
Two identical machines can produce very different reliability records because their exposure differs. Payload, haul profile, road condition, ore abrasiveness, ambient temperature, altitude, water quality, dust loading, operator technique, idling, and shift pattern all change the stress applied to components. Fixed equipment is similarly affected by feed variability, tramp material, surge conditions, lubrication environment, and process instability.
Metrics should therefore be normalized where practical. Haul truck tyre life may need to be considered against tonne-kilometres and heat exposure; crusher wear against tonnes processed and feed characteristics; hydraulic failures against operating hours, load cycles, and contamination evidence. Normalization does not eliminate uncertainty, but it prevents a heavily loaded machine from appearing inherently unreliable simply because it experiences greater exposure.
Changes in operating conditions also need to be visible in the maintenance record. If a new haul route, deeper pit, harder material, altered blasting practice, or extended shift pattern changes duty severity, historical intervals may no longer be a valid planning basis.
What a predictive reliability review should challenge
The most productive review is not a search for the lowest individual metric. It should challenge the relationship between metrics. Is MTBF declining for a subsystem while condition alarms increase? Is MTTR rising because access and parts delays are increasing? Are repeat repairs concentrated after a particular maintenance task? Is backlog age growing around the same systems that produce nuisance stoppages? Does contamination evidence align with pump, valve, bearing, or gearbox failures?
These questions convert maintenance data into a failure-control process. They also prevent a common error: treating every stoppage as an isolated event. In harsh operations, failures are often linked by common causes—abrasion, heat, vibration, contamination, overload, poor installation, inadequate inspection access, or an unresolved control-system defect.
Reliable mining assets are not those that never show abnormal signals. They are those where abnormal signals are captured accurately, assessed against operating context, and converted into intervention before the remaining useful margin is exhausted. MTBF, MTTR, availability, condition trends, backlog age, and parts readiness become valuable only when they are connected to that operational decision.
Related News
 MSHA Issues Mine Truck Safety Alert After One Death and 121 InjuriesMining Infrastructure ExpertMSHA mine truck safety alert reports one death and 121 lost-time injuries. Discover why mine operators should review safety practices.
 How to size a crushing plant for ore processingMining Infrastructure ExpertSize your ore processing equipment crushing plant with confidence. Learn how to calculate throughput, assess ore characteristics, and prevent bottlenecks.
 Trump Administration Rewrites Mining Policy to Spur Critical Minerals DevelopmentMining Infrastructure ExpertU.S. critical minerals mining policy is changing. Explore what faster approvals could mean for investment, equipment demand and supply chains.
 How IEC 62443 defines security zones for industrial communication systemsRobotics EngineerExplore industrial communication systems and IEC 62443: learn how security zones, conduits, and risk-based controls help protect plant operations.
 China-Peru Trade Agreement Upgrade Takes Effect, Easing Machinery CertificationConstruction Equipment SpecialistThe China-Peru trade agreement upgrade simplifies machinery certification. Discover what mutual recognition could mean for exporters entering Peru.
 How do industrial control systems regulate water treatment?Robotics EngineerDiscover how industrial control systems in water treatment use sensors, PLCs, and SCADA to regulate processes and help operators respond to changing conditions.
 Exotec Report: 25% of Supply Chain Leaders Regret Warehouse Automation DecisionsRobotics EngineerWarehouse automation regret affects 25% of surveyed supply chain leaders, according to Exotec. Explore the cost, contract and readiness risks before investing.
 How to set maintenance intervals for mining equipment in AustraliaMining Infrastructure ExpertMining equipment maintenance Australia: Learn how to set service intervals using operating hours, site conditions and equipment data to reduce downtime.
 EY Survey Ranks Complexity as Mining's Top Risk for 2027Mining Infrastructure ExpertMining risk in 2027 is led by complexity, EY's survey finds. Discover how aging mines, declining ore grades and supply chain pressures are reshaping the industry.
 Can asset lifecycle management automation reduce equipment downtime?IEG Heavy Machinery & Automation AnalystDiscover how asset lifecycle management automation can reduce equipment downtime through timely maintenance, faster repairs, and smarter service workflows.
 Caterpillar Q3 2026 Revenue Rises 17% to $20.7 Billion as Both Equipment Segments GrowConstruction Equipment SpecialistCaterpillar Q3 2026 revenue reportedly rose 17% to $20.7 billion. Explore equipment segment growth and what it could mean for procurement planning.
 How to choose a rugged industrial control panel for wet environmentsRobotics EngineerChoose a rugged industrial control panel for wet environments. Compare IP ratings, materials, seals, and condensation control to improve reliability.